New Course: Practical Instruments
Learn everything you need to know about using Instruments to improve and diagnose your code! By Luke Parham.
Sign up/Sign in
With a free Kodeco account you can download source code, track your progress, bookmark, personalise your learner profile and more!
Create accountAlready a member of Kodeco? Sign in
Sign up/Sign in
With a free Kodeco account you can download source code, track your progress, bookmark, personalise your learner profile and more!
Create accountAlready a member of Kodeco? Sign in
Contents
Earlier this year, we surveyed raywenderlich.com subscribers to see what courses they wanted next. One of the top picks was a course on Xcode Instruments.
Here’s what some folks we surveyed had to say:
- “I have been developing for iOS for 4 years already and remember to have used Instruments just a few times. It was all due to the fact that it is extremely hard for me to interpret the data Instruments produce.”
- “I have been coding iOS for a number of years now, but I have never really gotten the hang of instruments, which really annoys me. I may be slow, but I find the task of figuring out where all my CPU and memory resources are used, a surprisingly difficult task in instruments.”
- “As a professional developer, I can’t believe how much I DON’T use instruments. I think it’s mostly because I don’t feel comfortable with it.”
It’s clear there’s a lot of confusion about Instruments, and as a huge Instruments fan I was really eager to share how useful and great it can be.
So for the past few months I’ve been working on a new course on the topic, and I’m thrilled to announce it’s available today: Practical Instruments!
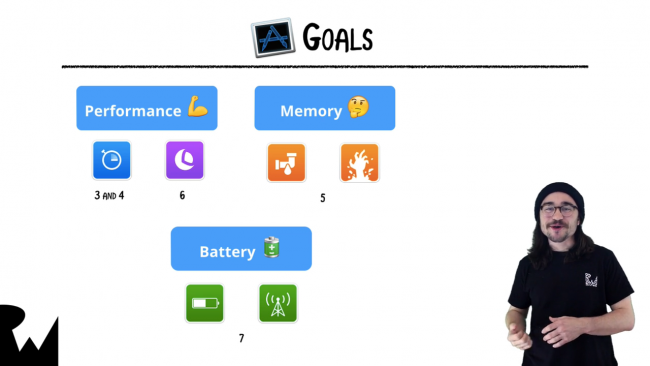
In this 8-part course, you’ll learn how to use Instruments to improve your code. You’ll get familiar with the interface, and find out which Instruments to use to solve your performance, memory, and battery problems in real-world scenarios.
This course is fully up-to-date with Swift 3, Xcode 8, and iOS 10. Let’s take a look at what’s inside:
Video 1: Introduction. In this video, you’ll get an introduction to the course and an overview of all the problems you can solve with Instruments.
Video 2: Instruments 101. This time you’ll get acquainted with Time Profiler and learn about the various panes and settings of an Instruments trace.
Video 3: Time Profiler. Learn how to profile your app’s performance as well as some strategies for speeding things up.
Video 4: Optimizing Launch. This time, you’ll zoom in on profiling and improving the launch time of your app.
Video 5: Memory. Learn how to track down and fix memory leaks using the Debug Memory Graph and the Leaks Template.
Video 6: Core Animation. Get a look at how you can profile and improve the performance of your app’s UI and how to find slowdowns that won’t show up in Time Profiler.
Video 7: Energy. Learn what kinds of things can affect your app’s energy usage as well as some strategies for tracking down and fixing problems.
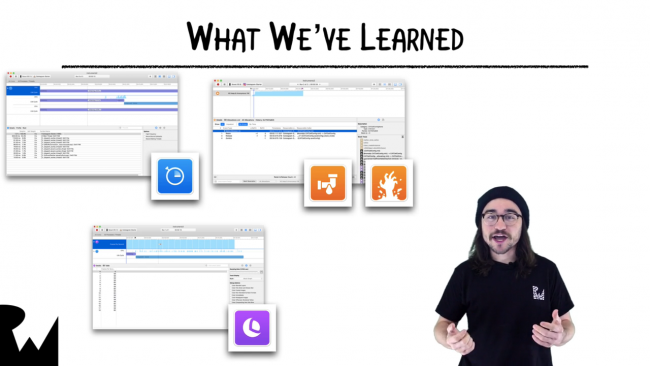
Video 8: Conclusion. In this video you’ll get a recap of what you’ve learned so far and a few pointers for further study.
Where To Go From Here?
Want to check out the course? You can watch the introduction for free!
The rest of the course is for raywenderlich.com subscribers only. Here’s how you can get access:
- If you are a raywenderlich.com subscriber: You can access the first two parts of Practical Instruments today, and the rest will be coming out over the next two weeks.
- If you are not a subscriber yet: What are you waiting for? Subscribe now to get access to our new Practical Instruments course and our entire catalog of over 500 videos.
There’s much more in store for raywenderlich.com subscribers – if you’re curious, you can check out our full schedule of upcoming courses.
I hope you enjoy our new course, and stay tuned for many more new Swift 3 courses and updates to come!


