View Debugging in Xcode 6
In this tutorial, you will learn view debugging by using some of the awesome new tools provided with Xcode 6! By Scott Berrevoets.
Inspecting Views
Now that the important parts are easily accessible, it’s time to look at layouts for these different views.
You already knew the collection view is what makes all these views come together, but wouldn’t it be great if you could just have an overview of the different elements that are at play here? Good news – you can!
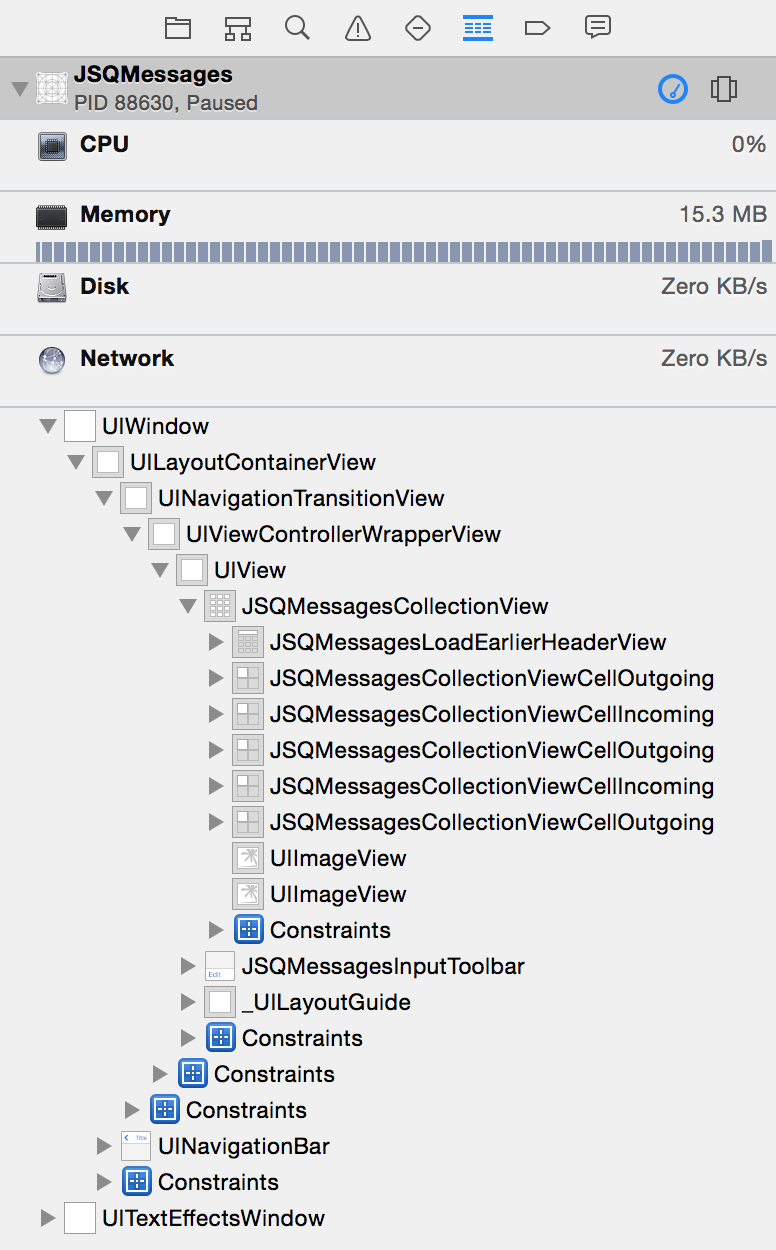
Press cmd + 6 to go to the Debug navigator. Since this is a debugging session just like any other, the Debug navigator provides contextual information about the current session. For view debugging, this means Xcode provides a view tree of all the views for all windows. Expand the tree in the Debug navigator to look like this:
Note: At the bottom of the Debug navigator, you’ll see options that give a little bit of control over what kinds of items display in this tree. Apple’s documentation claims the button on the left filters private elements out of system view implementations, though this button does not seem to work as of Xcode 6.2.
The button to the right hides views that have their hidden properties set to YES, and the search bar only displays views and constraints that match the search criteria.
For the purposes of this tutorial, you should have both buttons deselected and no search filter applied.
This is a good point to start exploring a little bit. Expand the last JSQMessagesCollectionViewCellOutgoing. It only has one subview: a UIView.
If you’ve worked with collection views before, you know this makes sense because any UICollectionViewCell has a contentView property that contains the cell’s contents.
Click — don’t expand — on that UIView in the Debug navigator and you’ll see that Xcode has now highlighted it in the canvas so you know exactly where it is on the screen.

To really understand how iOS positions that cell, open the Size Inspector with cmd + option + 4. The top part of the visualizes the view’s bounds, position and anchor point.
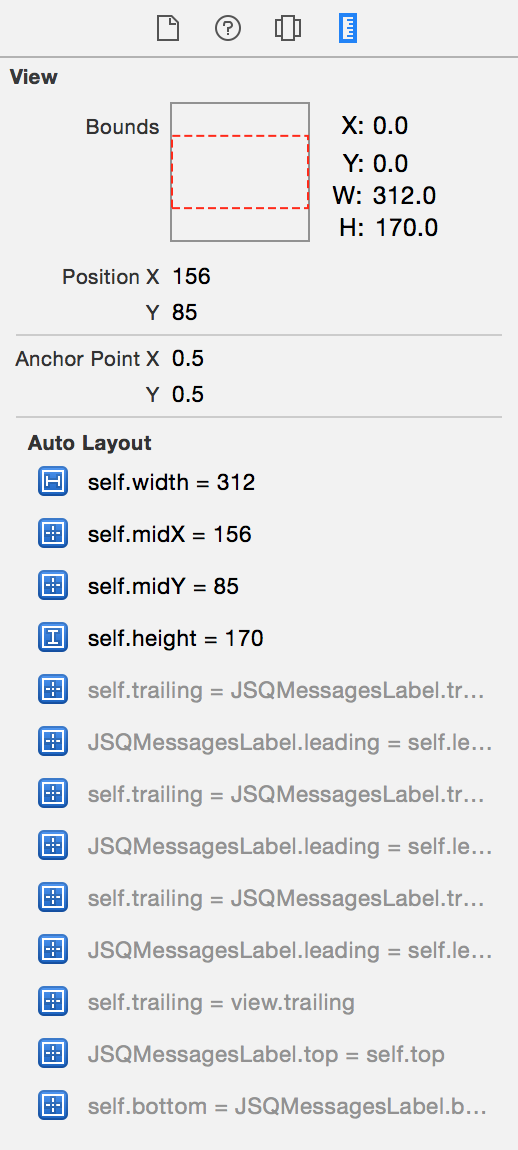
However, the really interesting part is the list of Auto Layout constraints that apply to this view. You can immediately tell that the cell’s content view is 312 points wide, 170 points tall and centered in its parent. The containing cell is also 312 by 170 points, so you know the content view takes up the entire cell.
Below are constraints colored in gray that indicate those are constraints that dictate relationships between this view and its subviews.
To get more details about a particular constraint, first expand that view in the view tree and then the Constraints item. You’ll also see the same constraints you saw in the Size navigator listed here.

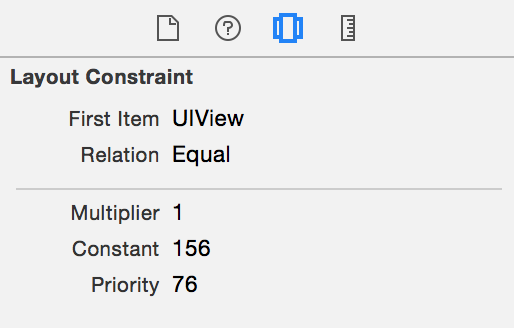
Click on the first constraint (for me it’s a constraint on self.midX) and switch to the Object inspector by pressing cmd + option + 3. You’ll see a constraint overview with the items, multiplier, constant and priority. This is much like the summary you see in Interface Builder when you edit a constraint.
In addition to sizing and constraint information, you can see other details related to the display of a particular view in the object inspector. Back in the Debug navigator, expand the UIView in the tree and you’ll see there are three JSQMessageLabels and two UIViews under it. Select the first JSQMessageLabel (the one with the timestamp), and open the Object inspector.

The first section indicates the object’s class name and memory address, and the second shows values for various public properties of the object that pertain to its appearance.
Here you can see the label’s text color is 0.67 gray with no alpha, and its font size is 12pt.
Other classes have useful information specific to how they’re visualized as well. Back in the Debug navigator, expand the second UIView under the cell’s root UIView and you’ll see a UIImageView.
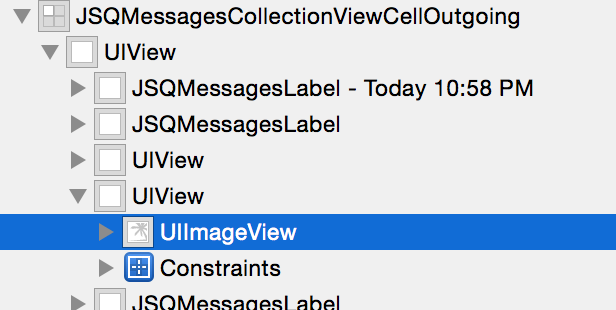
Select the image view from the tree and check out the Object inspector.
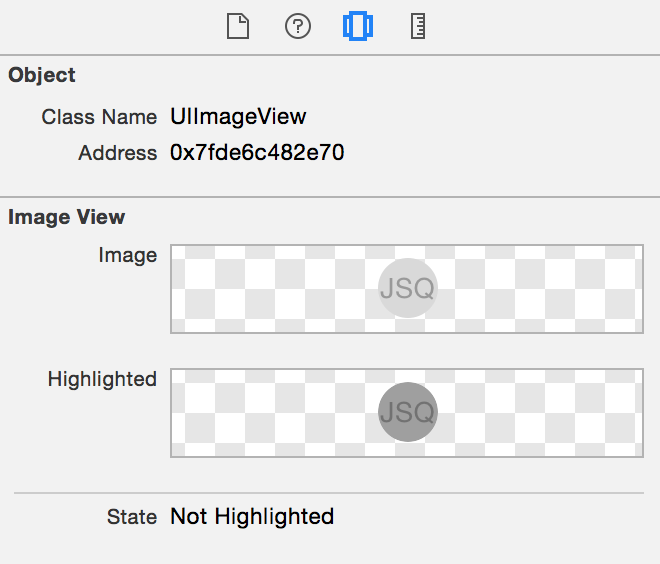
Here you’re looking at the view that shows the user’s avatar — in this case, the author’s initials, JSQ. You can see the normal image, conveniently labeled Image, as well as the darker image, labeled Highlighted, that shows when the user taps on the cell.
The other two instances of JSQMessageLabel in this cell’s root view don’t currently have text, but they are used for the sender’s name in incoming messages and an error message when sending an outgoing message fails.
And that’s how easy it is to do view debugging in Xcode! To continue running the app, just click the Continue button on the Debug bar, or go to Debug\Continue, just like you would if you were in a normal debug session.
Live Modifications
Now that you know the basics of view debugging in Xcode 6, it’s time to put that knowledge to work with a small exercise: For the collection view you’ve been exploring throughout the tutorial, make its vertical scroll indicator red by only using the debugger.
Here are two tips to get you started:
- Since view debugging is just like any other debugging session, you can use
exprand other commands in the console, but keep in mind changes won’t appear until you resume execution. For more information on these commands, take a look at this debugging apps in Xcode tutorial. - Because pointers in Objective-C are really just memory addresses, you’re simply messaging a memory address when you message an object. This works in the debugger as well, so a command like
po 0x123456abcdefwould print the description of the object at that memory address.
Give it some solid attempts before you break down and look at the solution below!
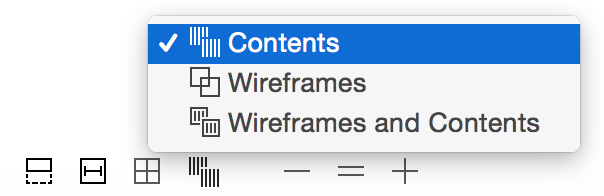
[spoiler title="Solution"]First, make sure the view mode is set to “Contents”.
In the Debug navigator, expand the view tree of the collection view so you can see all its subviews.
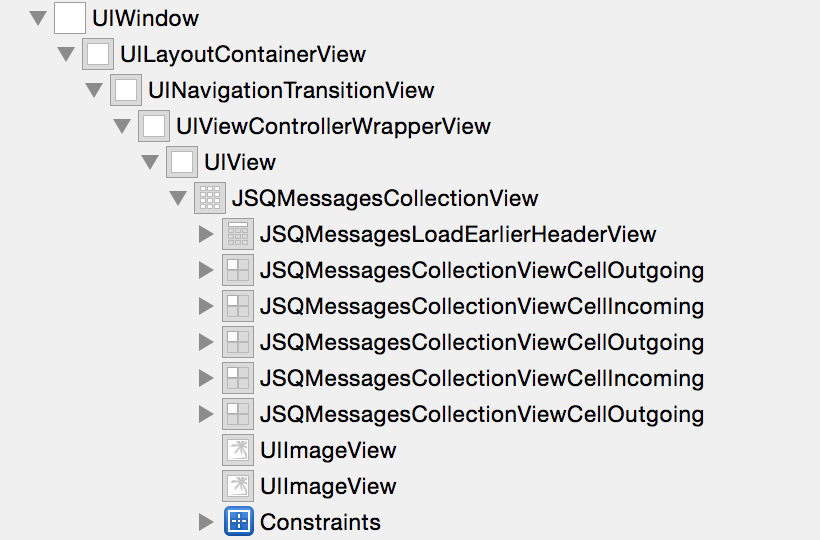
The last views of the collection views are two instances of UIImageView. These are the horizontal and vertical scroll indicators. Click on the second one, and you’ll see the vertical indicator highlighted in the canvas.

Copy the image view’s memory address from the Object inspector.
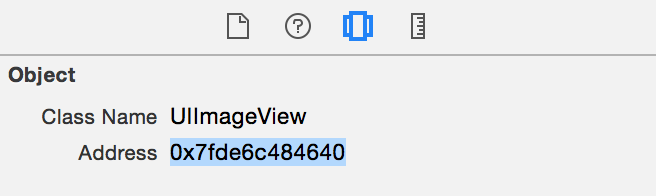
In this case, the memory address of the scroll indicator was 0x7fde6c484640. All that’s needed to color the scroll view indicator is to send a setBackgroundColor: message to the object at that address. The following will do just that:
expr (void)[0x7fde6c484640 setBackgroundColor:[UIColor redColor]]
Continue running the app, and you’ll notice the scroll indicator is red when you scroll the through the collection view.
[/spoiler]
Congratulations, you now know the basics of view debugging with Xcode 6!