What’s New in Android Studio 2.0
Android Studio 2.0 was just released – take a quick tour of what’s new! By Huyen Tue Dao.
Sign up/Sign in
With a free Kodeco account you can download source code, track your progress, bookmark, personalise your learner profile and more!
Create accountAlready a member of Kodeco? Sign in
Sign up/Sign in
With a free Kodeco account you can download source code, track your progress, bookmark, personalise your learner profile and more!
Create accountAlready a member of Kodeco? Sign in
Contents
What’s New in Android Studio 2.0
20 mins
- Getting Started
- Improved IDE
- IntelliJ Features
- Deep Links Integration
- Unified Unit Tests and Android Instrumentation Tests
- GPU Profiler
- Android Emulator 2.0
- New Interface
- Phone Call/SMS
- Battery and Charging States
- Location Updates
- Better Builds
- Faster Build Speeds
- Faster ADB
- Instant Run
- Where to Go From Here
Unified Unit Tests and Android Instrumentation Tests
If you are familiar with unit testing on Android, you know that there are two types of unit tests in Android Studio:
- Local unit tests are unit tests without dependencies on the Android framework; these run on the local machine only.
- Instrumented unit tests are unit tests that have Android dependencies and must run on a device or emulator.
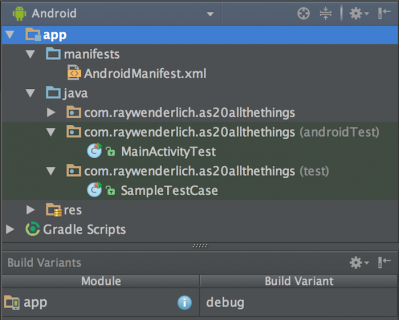
In previous versions you had to choose one of the two types from the Test Artifacts setting in the Build Variants window. You could only run tests of that type, and would only see tests of that type in the project overview.
Unit Tests selection, before Android Studio 2.0
Android Instrumentation Tests selection, before Android Studio 2.0
Android Studio 2.0, however, has a unified testing view. Now you can view and run both kinds of tests, eliminating the need to choose a test artifact.
For more information about unit testing in Android, check out developer.android.com.
GPU Profiler
A huge feature for GL graphics developers is the new GPU profiler. Aiming to save developers huge amounts of time during graphics debugging, the GPU profiler provides the power to closely examine the GPU state. Developers can record and replay a scene frame-by-frame as well as view the sequence of GPU commands that created that state and scene.
This article doesn’t look at all the details of the GPU profiler, but you can find out more on the Android Tools Project Site.
From the Android Dev Summit keynote presentation: https://youtu.be/xdItHEVfQ4U?t=15m57s
Depending on the apps you write, the GPU profiler may not be something you use often, but the next section will look at improvements in something that you probably have used many, many times: the Android Emulator.
Android Emulator 2.0
It’s fair to say that not many developers love the Android Emulator, and that many have lamented its super-slow start up and laggy performance. For a long time, the emulator lacked many of the features and UI convenience of third-party emulators.
Happily, the Android Emulator 2.0 has completely changed the game, receiving both a much-improved UI as well as a massive speed-up.
New Interface
The first thing to notice about the Android Emulator 2.0 is that while the screen rendering area might look the same, with a phone frame and gray window border, the emulator has a new toolbar.
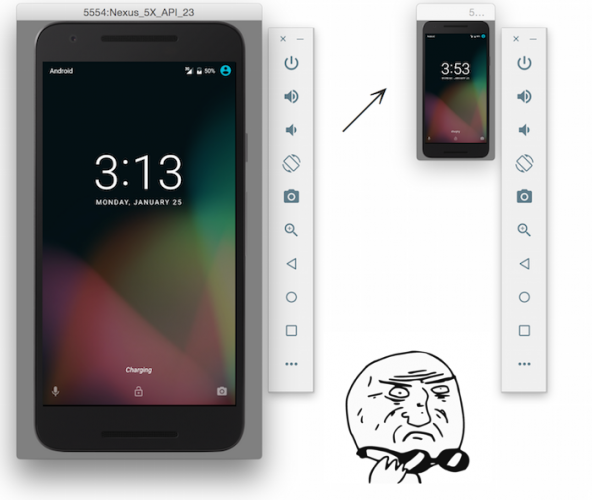
The Android team also added a feature that sounds simple but was, as they said, a frequently-wished-for improvement: the ability to resize the emulator by dragging the window (to sometimes ridiculous results).
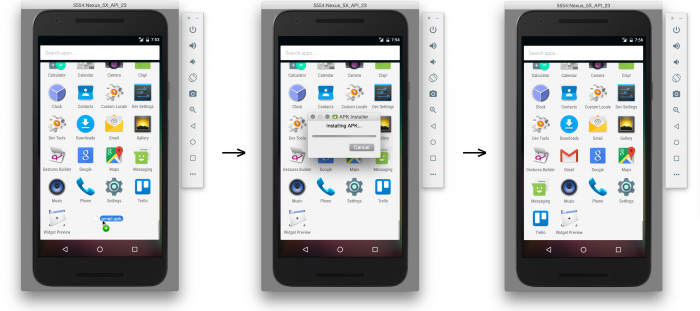
Speaking of dragging, you can now transfer files onto the virtual device by dragging-and-dropping.
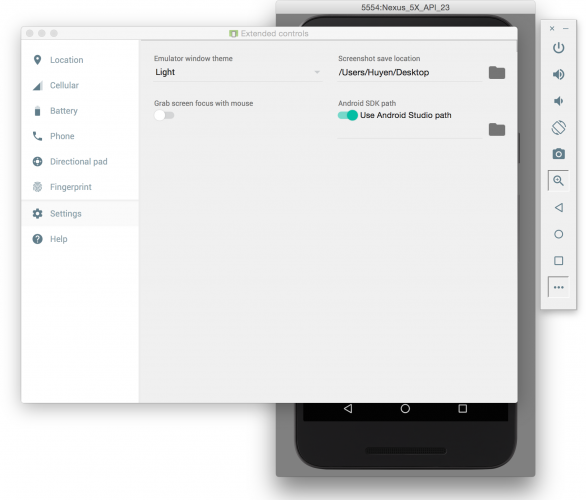
The new emulator toolbar provides easy-access controls for the emulator, such as Volume, Back, Home and Power Off. It also provides a screen rotation button (the old emulator required a keyboard shortcut or an arcane ADB command) and a screenshot button.
Click the bottom button of the toolbar to see the Extended controls window appear. Select Settings. From here, you can set the destination folder for screenshots:
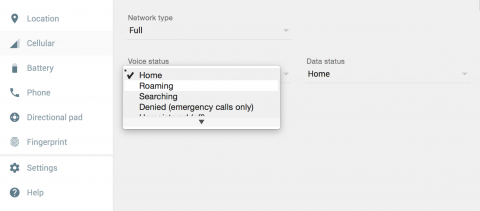
The Extended controls window shows more of the awesome features Android Studio 2.0 provides for testing your app. You can emulate device conditions and verify behaviors such as how your app would handle different types of networks and speeds, battery status changes, location updates and more.
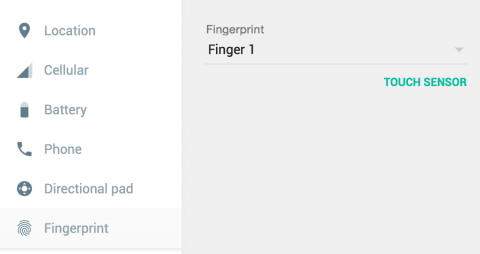
There is even a control for emulating fingerprint sensor input.
Let’s try out a few of these in the companion app.
Phone Call/SMS
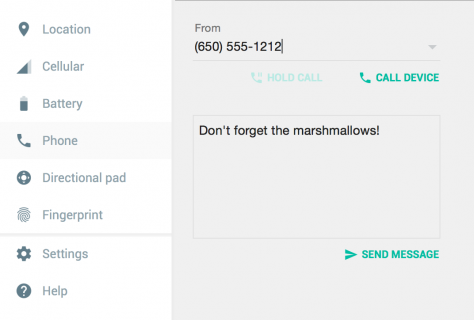
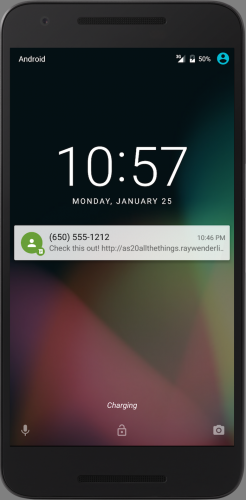
Select Phone in the Extended controls window. You should see a form that contains input for a phone number and text message:
In the SMS text, enter Check this out! http://as20allthethings.raywenderlich.com/deeplink
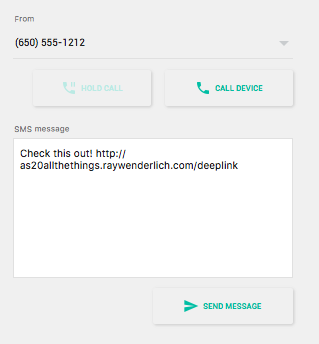
Click SEND MESSAGE.
Woohoo! You just sent your emulator a text message without breaking a sweat.
Note: As you might remember from the discussion about deep links integration, the companion now has an intent filter that handles the URL in the text message.
If you want to see the deep linking in action, open the SMS in the emulator and click the link.
Note: As you might remember from the discussion about deep links integration, the companion now has an intent filter that handles the URL in the text message.
If you want to see the deep linking in action, open the SMS in the emulator and click the link.
Battery and Charging States
Another device state you can directly set and manipulate in version 2.0 is the battery status and charging state.
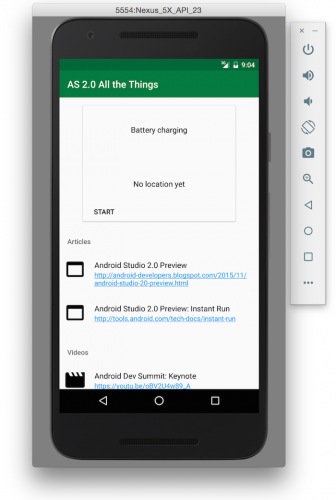
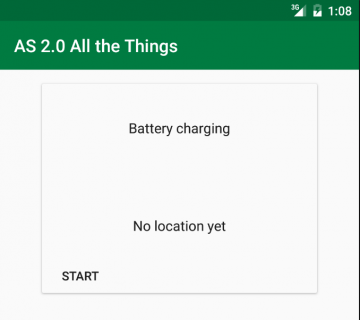
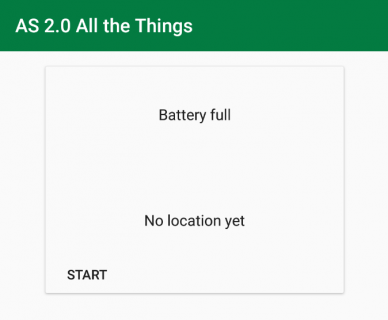
Launch the companion app. Part of the logic in the top card displays the current battery status of the device, and if you look at the battery status of the emulator and the battery status message in the top card, you will see that they match.
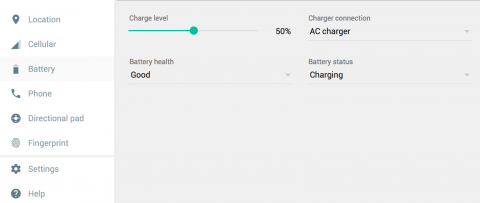
To make changes, open the Extended controls window and select Battery.
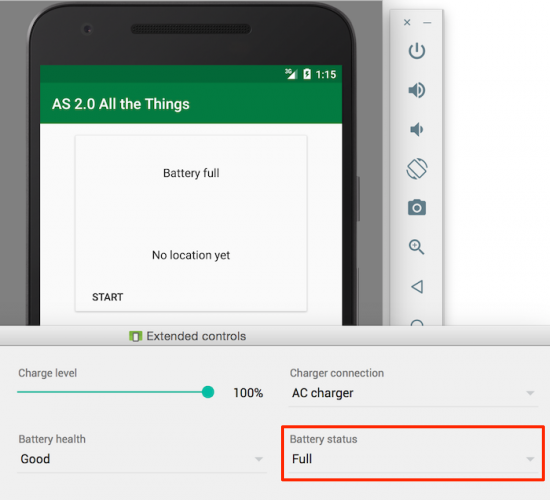
There are several controls for manipulating the battery status. Use the Charge level slider to change the battery level, and watch it instantly update in the status bar of the emulator. To explicitly set the battery status, select Full from the Battery status dropdown. The top card detects the change and displays the new status immediately.
Location Updates
For your last stop on the extended controls portion of the tour, you will practice pushing location updates to the emulator.
If you look at the top card, you will see the text “No location yet”.
The top card listens for location updates and displays the received location coordinates. Right now it is just waiting for you to give it some!
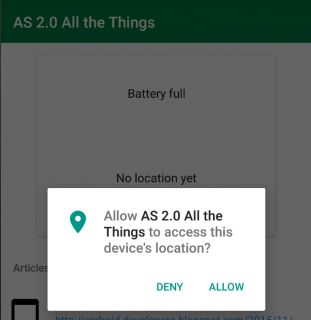
In the companion app, click the Start button. You’ll be prompted to give the app access to the device’s location. Click ALLOW.
At this point, the companion app waits for location updates.
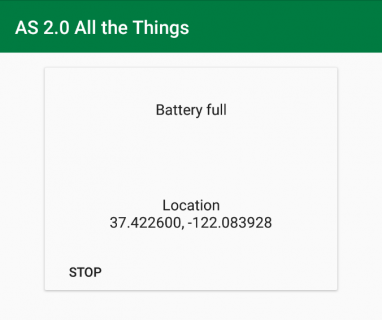
To pass it an update, open the Extended controls window again and select Location. With Decimal selected, enter 37.4226 into Latitude and -122.084 into Longitude. Click SEND.
The top card should immediately update to reflect the new location.
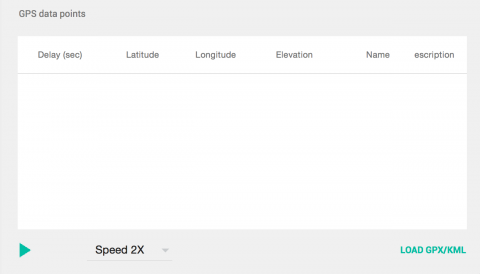
If you don’t want to enter in location updates one by one, you can even load a set of coordinates into the window and “play” that list.
With all these tools and more, Android Emulator 2.0 has been packed with exciting new utility and a streamlined interface. It is definitely worth the ride.


